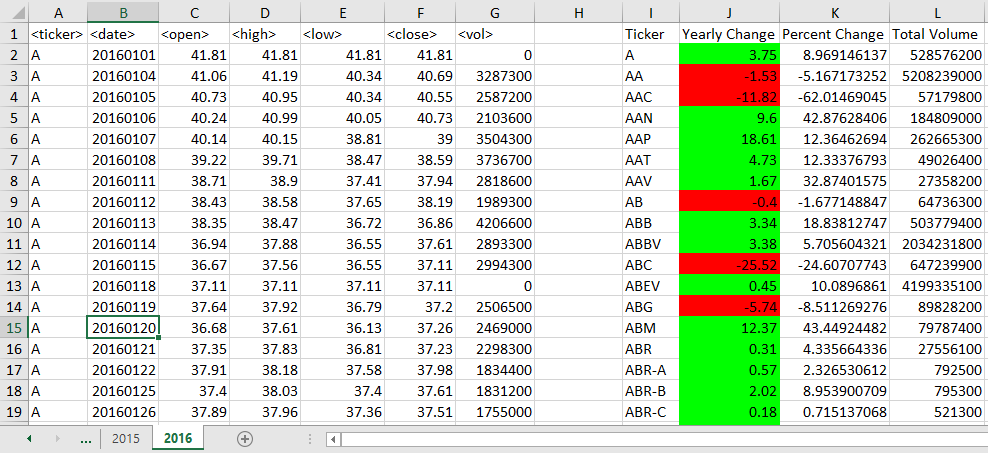
Coding in VBA to crunch excel spreadsheet data wasn’t very fun, but it was good mental exercise and got my mind working. I found the language obtuse compared to python, and making mistakes that output to the spreadsheet was annoying to clean up. Not to mention the numerous times I crashed the excel application with infinite loops, lol. Either way, I am proud of the code I wrote. I don’t do much stock analysis in excel, and typically use SQL and python for that stuff, but I still might revisit this exercise and use it to crunch some of the stock and option data I collect. My code produces the I-L values:
Sub stock_hw()

Dim total_rows As Double
Dim sym_array() As Variant
Dim total_volume As Double
Dim i As Long
Dim j As Long
Dim unique_syms As New Collection
Dim sym As Variant
Dim ws As Worksheet
Dim unique_index As Double
Dim first_price As Double
Dim last_price As Double
Dim first_bool As Boolean
Dim prcnt_chng As Double

'Creates the loop to go through each worksheet in the workbook
For Each ws In Worksheets

    'activate the worksheet and enter new column names in J and K
    ws.Activate

    'insert the headers
    Cells(1, 9).Value = "Ticker"
    Cells(1, 12).Value = "Total Volume"
    Cells(1, 10).Value = "Yearly Change"
    Cells(1, 11).Value = "Percent Change"

    'calculate the total rows to use in the array range
    total_rows = Rows(Rows.Count).End(xlUp).Row

    'add stock tickers to array
    sym_array = Range(Cells(2, 1), Cells(total_rows, 1)).Value

    'loop through array to find distinct values and add them to a collection object
    'set the collection to Nothing to reset it on each worksheet

    Set unique_syms = Nothing

    'resuming on error is needed or it will error on duplicate values
    On Error Resume Next
    For Each sym In sym_array
    unique_syms.Add sym, sym
    Next

'populate column J with distinct ticker values
    For i = 1 To unique_syms.Count
        Cells(i + 1, 9).Value = unique_syms(i)
    Next i

'USED FOR DEBUGGING 'Cells(1, 11).Value = Cells(2, 1).Value
'USED FOR DEBUGGING 'Cells(1, 14).Value = Cells(2, 9).Value

    'check to see if the distinct value = sym and total the volume if it does
    'j loops through the master ticker list
    'unique_index is used to stay on the correct distinct ticker
    'set the first boolean to true so the logic knows to store the first price

        first_bool = True
        unique_index = 2
        For j = 2 To total_rows + 1
            If Cells(j, 1).Value = Cells(unique_index, 9).Value Then
               total_volume = Cells(j, 7).Value + total_volume

               'Logic for storing the first price when it is greater than 0
                 If first_bool = True And Cells(j, 6).Value > 0 Then
                    first_price = Cells(j, 6).Value

                   'set the first boolean to false so the logic doesn't change the first price
                    first_bool = False
                 End If

            Else
                'subtract 1 from j so you don't skip the first row for the next distinct ticker
                'also so you can select the correct last closing price
                 j = j - 1

                 'set the last closing price value
                last_price = Cells(j, 6).Value

                'output volume
                Cells(unique_index, 12).Value = total_volume

                'output difference between start and end price
                Cells(unique_index, 10).Value = last_price - first_price

                'calculate the percent change
                prcnt_chng = ((last_price / first_price) - 1) * 100

                'output the percent change
                Cells(unique_index, 11).Value = prcnt_chng

               'format the cell color based on the percent change being positive or negative or 0
                    If prcnt_chng > 0 Then
                        Cells(unique_index, 10).Interior.ColorIndex = 4
                    ElseIf prcnt_chng < 0 Then
                        Cells(unique_index, 10).Interior.ColorIndex = 3
                    Else
                        Cells(unique_index, 10).Interior.ColorIndex = 2
                    End If

                'increase the unique index
                unique_index = unique_index + 1

                'rest the sum of volume so it doesn't carry over for the next ticker
                total_volume = 0


                'reset the boolean value for figuring the first price
                first_bool = True

           'USED FOR DEBUGGING ' Cells(1, 11).Value = first_price
           'USED FOR DEBUGGING ' Cells(1, 14).Value = last_price
            End If
         Next j
'USED FOR DEBUGGING 'Cells(1, 15).Value = total_volume
      ws.Columns("A:M").AutoFit
    Next ws
End Sub
